Metrics
Restate servers expose operational metrics in Prometheus exposition format via the Node-ctrl endpoint, i.e. localhost:5122/metrics. For instance, configure Prometheus to scrape this endpoint every 30 seconds by adding this section to Prometheus configuration (assuming Restate server's IP address is 10.10.10.1 and accessible by Prometheus:
scrape_configs:- job_name: restate_server_1 metrics_path: "/metrics" static_configs: - targets: - 10.10.10.1:5122
Note that some metrics are dependent on the value of rocksdb-statistics-level in the configuration file. In most cases, the default value will be sufficient for production deployment monitoring.
Example Metrics
This is a non-exhaustive list of metrics that can be used to measure system performance:
restate_ingress_requests_total(counter) - Number of ingress requests in different states (admitted, completed, throttled, etc.)restate_ingress_request_duration_seconds(summary) - Total latency of Ingress request processing in secondsrestate_rocksdb_estimate_live_data_size_bytes(Gauge) - Size of the live data in RocksDb databases in bytesrestate_invoker_invocation_task_total(counter) - The number of invocation tasks to user handlers
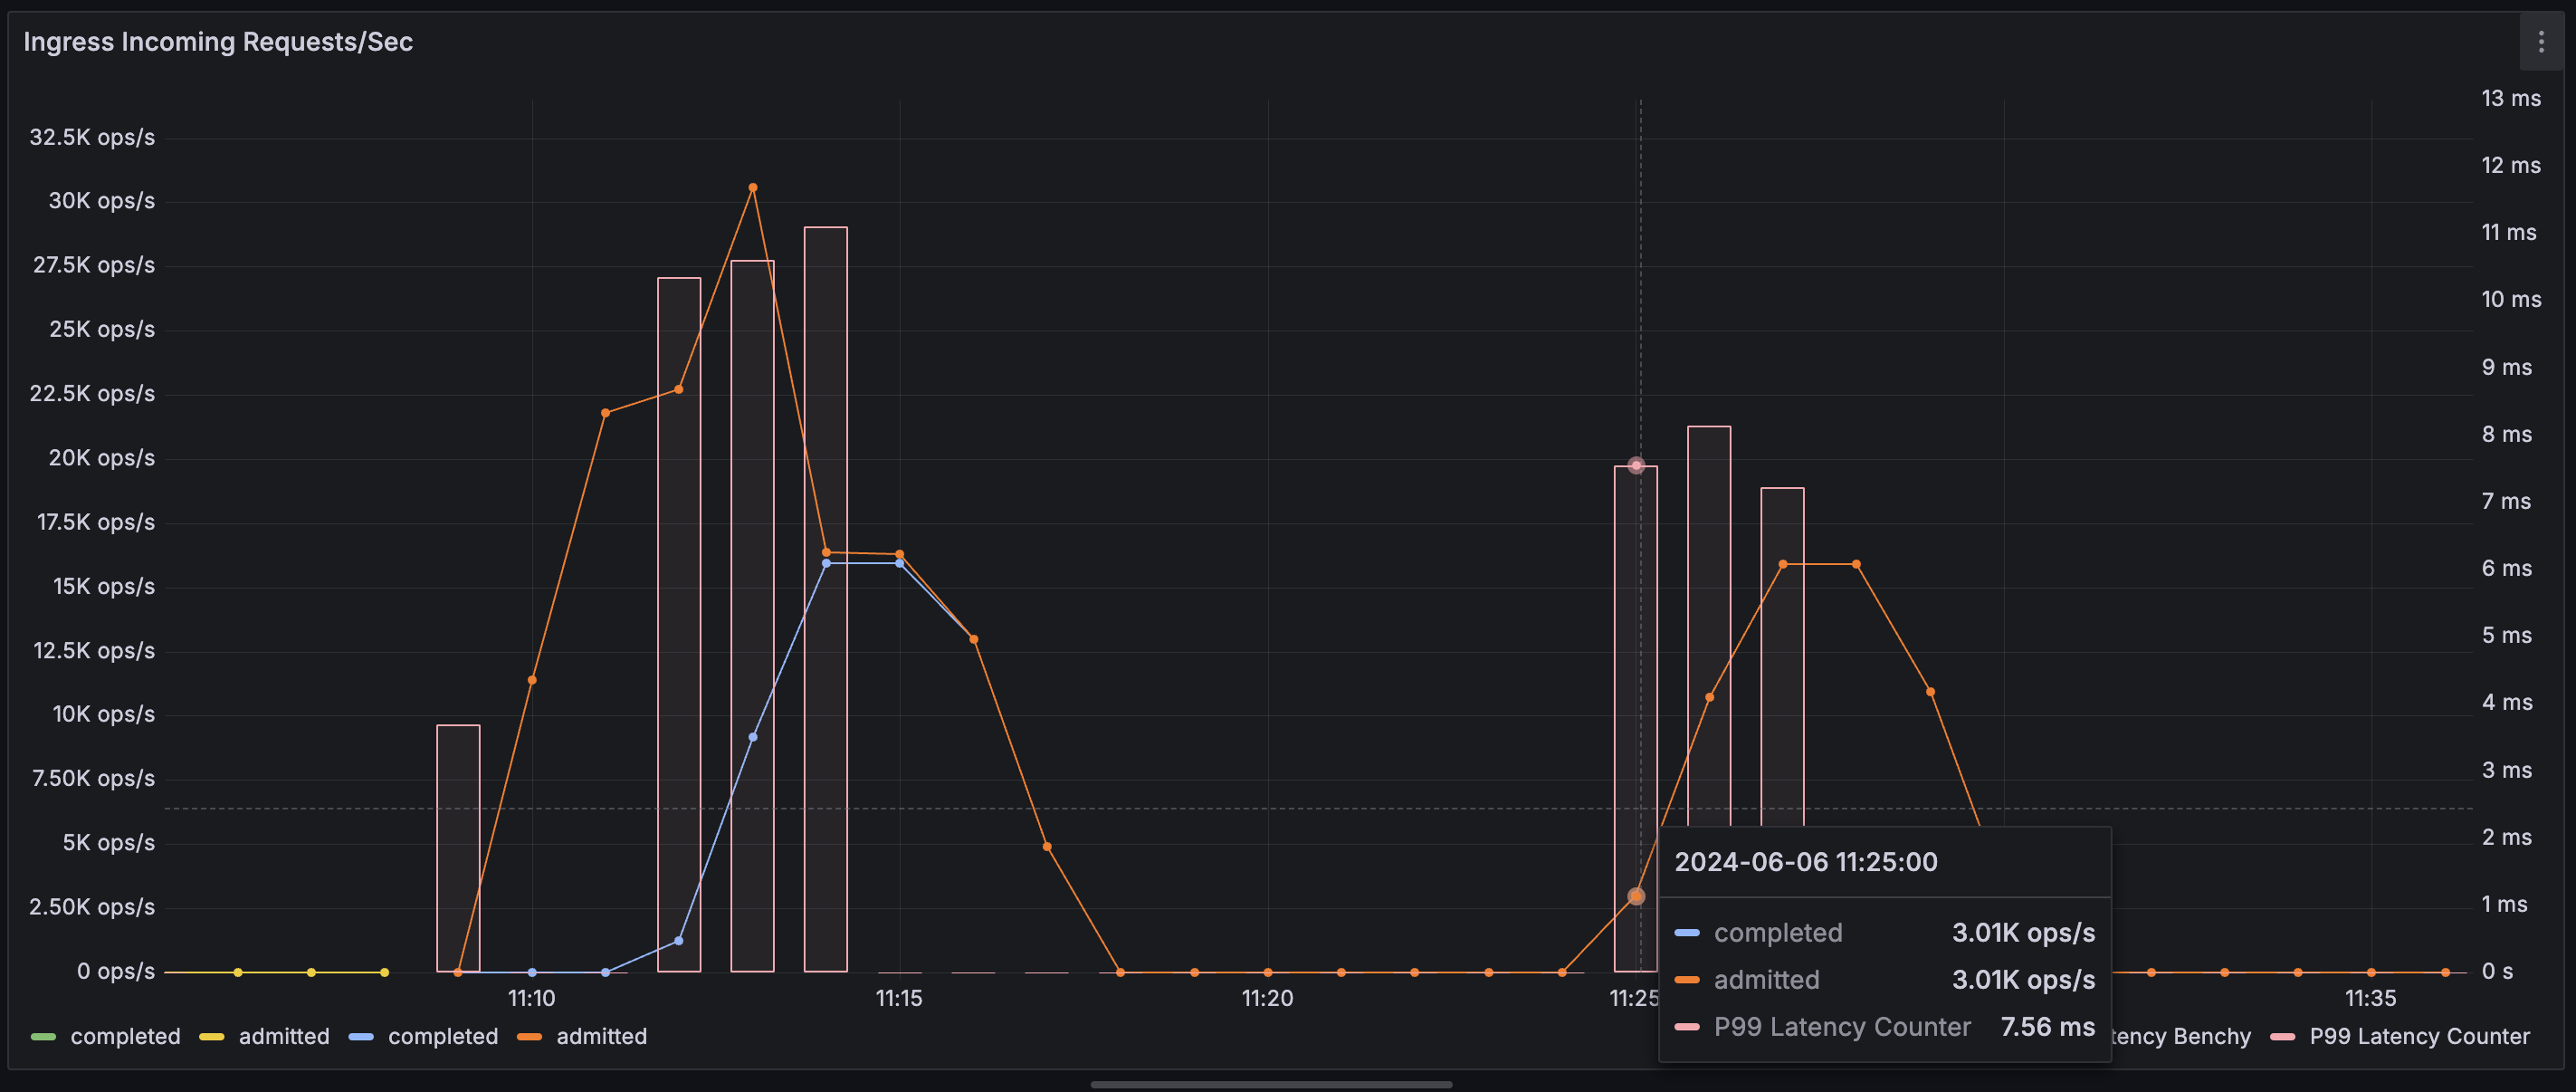
For example, we can use the following Prometheus queries to visualize throughput (ops/s) of HTTP ingress requests with an overlay of P99 latency:
rate(restate_ingress_requests_total{job="restate_server_1"}[$__rate_interval])
restate_ingress_request_duration_seconds{job="restate_server_1", quantile="0.99"}
